City Finances, a Current Snapshot
During the 2019 city council campaigns the general buzz was that our city finances were in distress, and that our economic development outlook was in a state of mismanaged malaise. Claims were made that we are recklessly falling behind, and that only an aggressive change in economic development policy, replicating that of neighboring suburbs, would save us from ourselves. A few cooler heads, understanding that the economic fundamentals of our city remain strong, and that the current budget is constrained largely because of short-term factors (e.g., a vacant Anthem and moving the 911 call center), said otherwise. But to this day the prevailing perception is that the city’s financial position is precarious.
So what is the reality? As we head in to 2020, what is the actual state of things in Worthington— in terms of both the city’s current financial condition and the economic development outlook for the new year?
In this blog post—“City Finances, a Current Snapshot”—I’ll address the first question by looking at some key numbers, and in a follow-up post—“Economic Development Highlights, 2020”—I’ll address the second question through commentary and an informational update. For now, let’s just say that 2020 will be highly significant for our economic development efforts and, underlying it all, for the choices we’ll be making about what kind of city we want to be. Multiple, high-profile proposals/projects—Stafford Village, UMCH, Harding/Boundless, the Holiday Inn site, and the Worthington Mall—are all likely to reach critical decision points this year. And the Anthem building, a significant economic factor for the city, will also likely see action in 2020. Some of these projects are straightforward, in-the-works, and relatively non-controversial, while others are quite the opposite. But more of this in the next post.
For now, let’s look at a few key metrics indicating the general state of city finances. (The most up-to-date financial report we have is for year-to-date (YTD) at 11/30/19. We’ll have full-year numbers in the next 2-3 weeks, but these are not expected to materially change the 11/30/19 results).
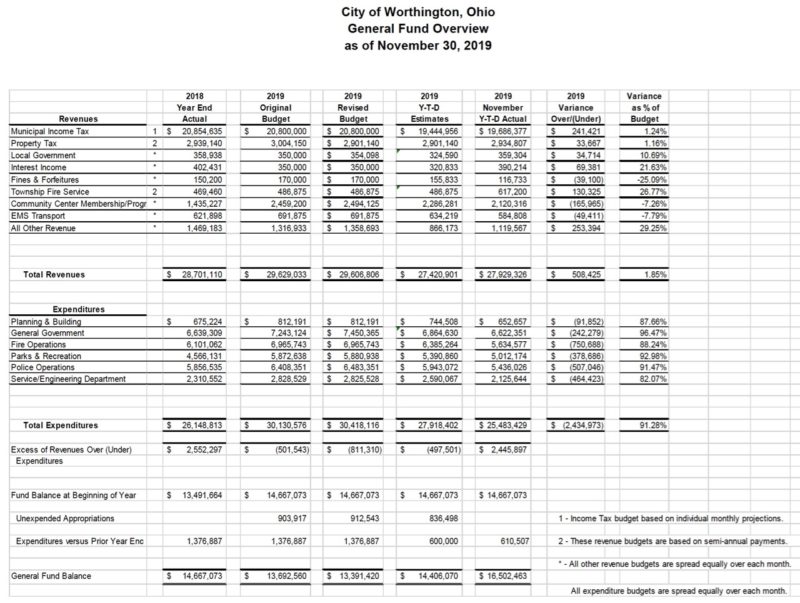
Let’s begin by looking at the performance of the General Fund (GF). Remember, the GF is where normal operations and programs are funded, and excludes the Capital Improvements Program fund (which generally receives 20% of income tax revenue), and a number of smaller, dedicated funds, such as street maintenance, water, sewer, pensions, etc. I look at the GF as the single most important indicator of current economic conditions and the city’s financial management practices.
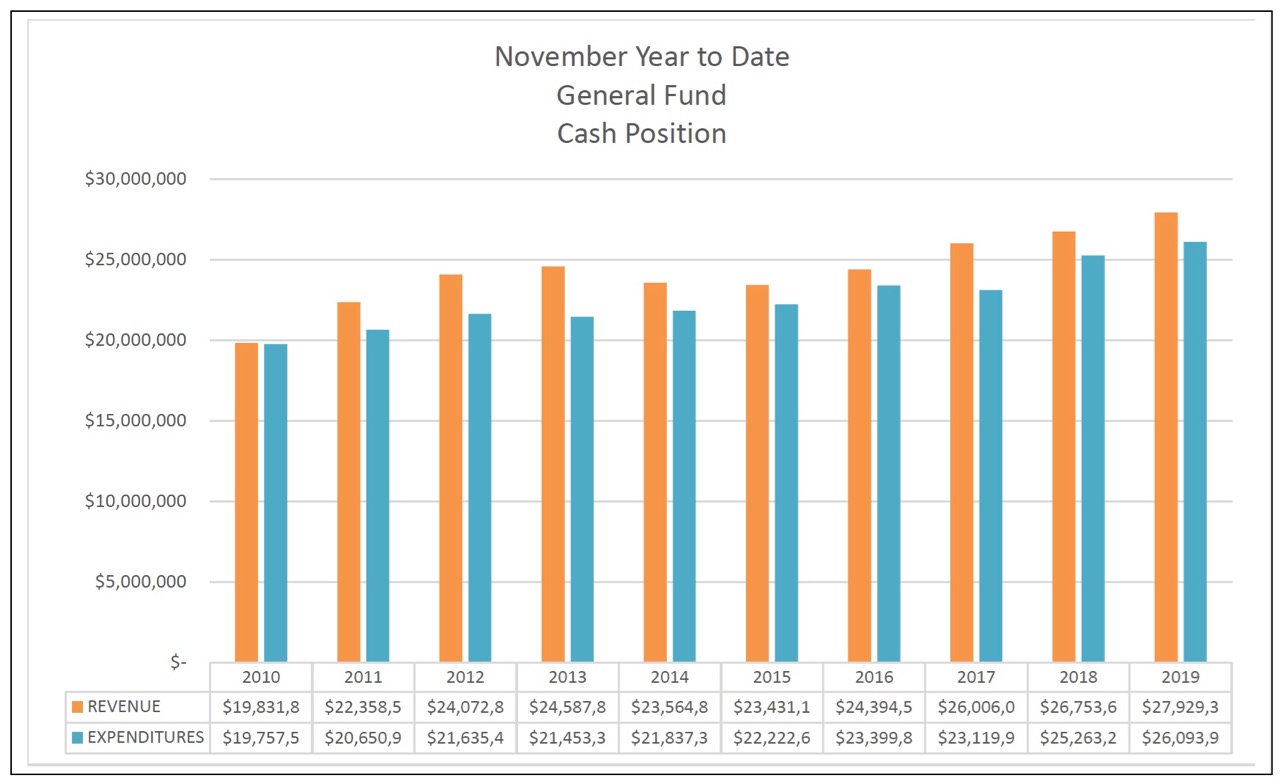
The chart below shows the total revenues and expenses for the GF, November YTD.
As you can see, total revenues have significantly exceeded total expenses. This reflects the fact that revenues are above projections YTD by over $500,000 while expenses are nearly $2,500,000 below projections. Nearly half of the higher than expected revenue is from income tax collections, while the reduction in expenses reflects reduced numbers of personnel who have not yet been replaced, traffic and engineering studies not yet paid for, opt-outs of the city’s health care benefits, etc. For further details, see the “General Fund Overview” chart at the very bottom of this post.
________________________________
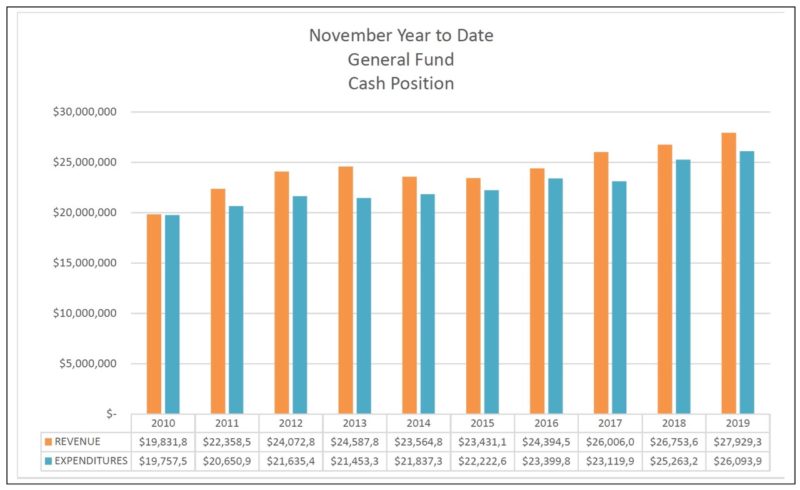
This better-than-expected GF performance of course impacts the GF cash position, sometimes referred to as the city’s “rainy day” or “opportunity” fund. As the numbers below indicate, our city’s cash balance has improved by nearly nearly $2 mill. compared to where we were at the start of the year (≈ $16.5 million vs. ≈ $14.6 million).
The “Unencumbered Balance” (“unencumbered” meaning “not yet committed”), at $14.8 mill. has risen to over 50% of prior year expenditures, a significant threshold that triggers reporting requirements by the City Manager to City Council (in essence, asking, “What is the responsible thing to do with this much cash on hand?”). A scheduled payment in January of $1.1 million for the 911 call center services will reduce our cash position, probably bringing it to slightly below 50%. (It should be noted that in 2021 the city will start realizing annual net savings of ≈ $300,000/year by having joined the regional 911 call center). ________________________________
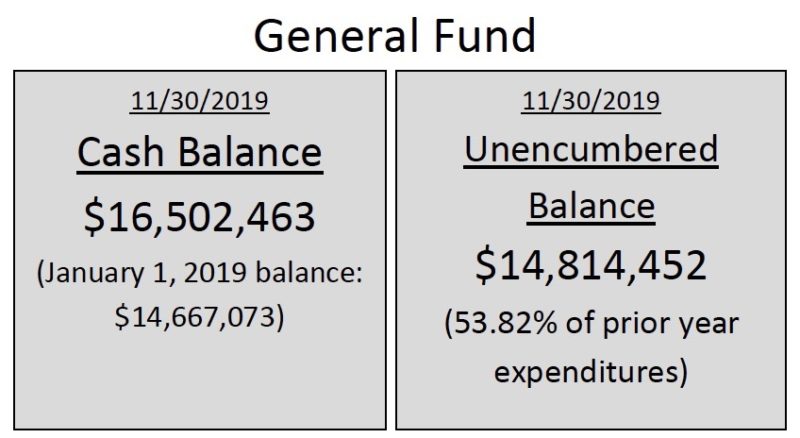
And here’s a chart, 2009-2018, that gives historical perspective on the GF Cash Balance (not the unencumbered balance); if the $16,502,463 (from 11/30/19) were added to this chart the trendline would continue rising steadily upward:
________________________________
Income tax collections do remain softer than desirable (some would say there is never enough), with the single biggest factor being the loss of revenue, beginning July 1, 2018, from the Anthem building. A full Anthem building is expected to yield, conservatively stated, anywhere from $500k to $1 mill+/year in revenue. We’ll discuss further this specific revenue factor, as well as income tax generation in general, in the forthcoming “Economic Development Highlights, 2020” post.
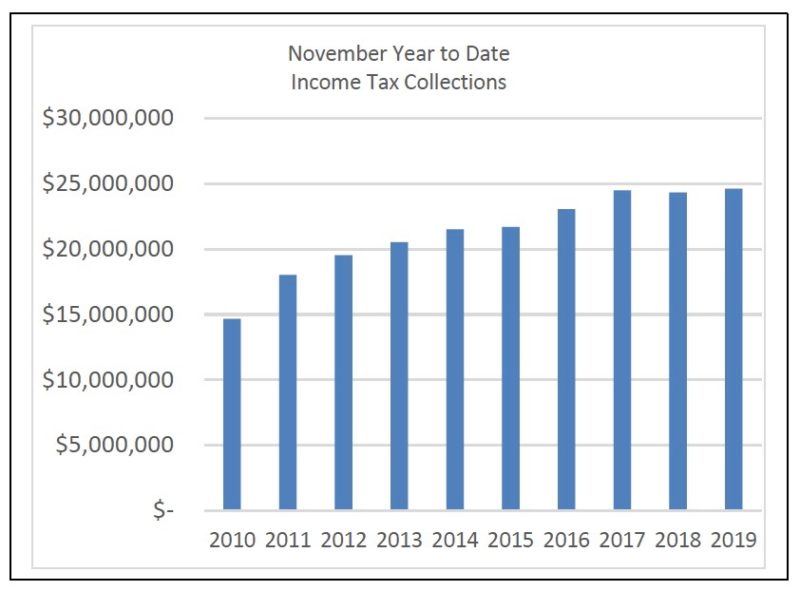
One other observation regarding the above chart. The 2017 numbers were unusually high due to one-time events above and beyond normal business operations. In other words, the 2017 number should not be seen as representing a trend line.
________________________________
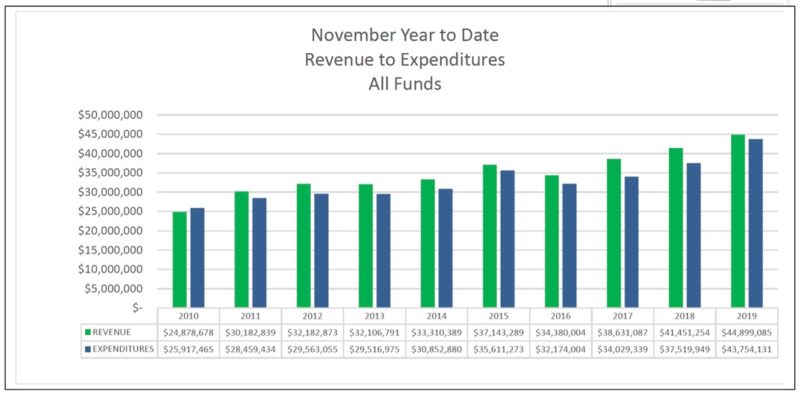
Revenue and Expenditures #s for “All Funds” is provided below, but I find this chart a bit misleading in that proceeds from bonds are considered to be revenue, which to me is quite different from revenue generated by business activity. Nonetheless, these numbers are meaningful.
________________________________
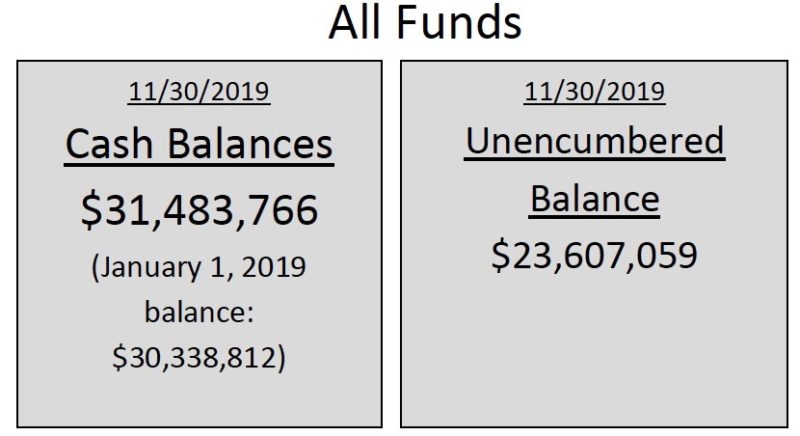
And here’s the numbers for the “All Funds” cash position:
________________________________
And, as indicated above, here’s detailed numbers for the General Fund:
________________________________
In closing, I welcome any and all feedback, questions, critiques. My purpose here is to help inform public understanding and discussion. I am sure that my presentation can be improved, and that I have left some questions unanswered. But if you engage me in reasoned discussion I will do my best to address any questions or concerns you may have. Thank you. Post #2, “Economic Development Highlights, 2020,” will be forthcoming soon.
You must be logged in to post a comment.